Why is Visualization Important for Learning Mathematics?
By Charlene Marchese
How often do we ask students to show their mathematical thinking or explain an answer using words, pictures, or diagrams? If you’re like most of us, the answer to that question is probably “Very often”!
But what does it mean to express mathematical ideas and processes through these modalities? What is our expectation that students’ work contains language that connects to diagrams and pictures? Are representations of thinking created after a solution is found, or are pictures, diagrams, and language part of developing a solution? To explore these questions, let’s first take a close look at four mathematical tasks, each requiring increasingly complex conceptual understandings, and the visual representations and language that can support understanding these tasks.
Examples in Action
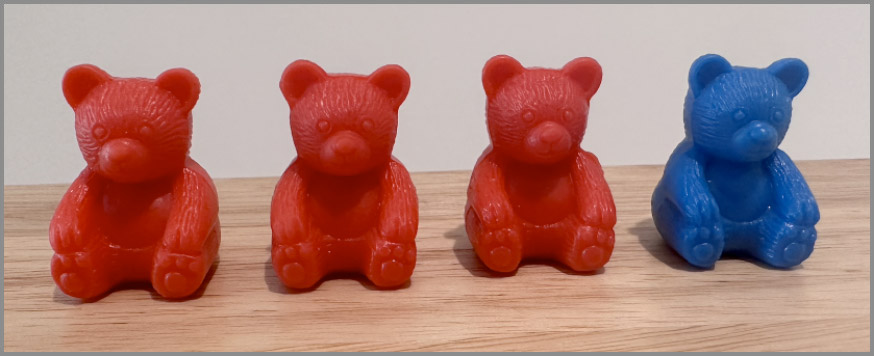
Example 1: An Early Childhood Story Problem
Sabrina has three red bears. She then finds one blue bear. How many bears does Sabrina have now?
Many children are introduced to story problems like this. For young learners, adding one on to a number or collection of objects is a complex concept and tackling a solution using a concrete model is a natural place to start.
If given a container of red and blue bears, a student could line up three red bears, place one blue one at the end of the line, and then count the four bears. To describe how they came up with their solution, a student could say, “I took three red bears and then one blue bear. Now I have 4 bears.”
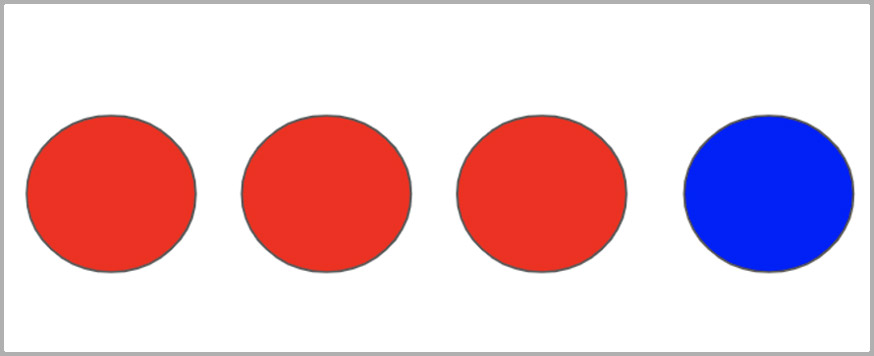
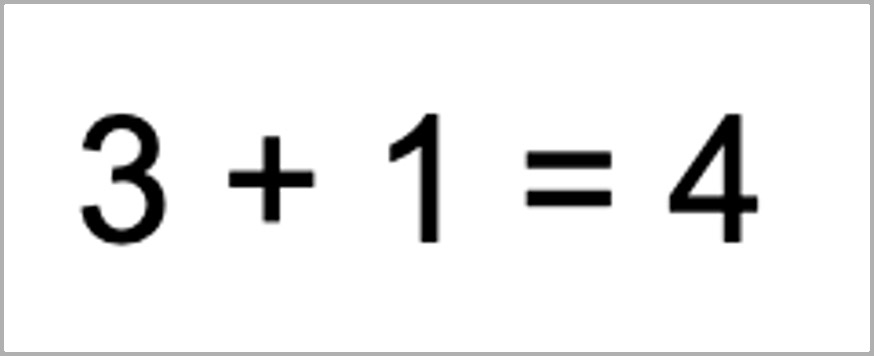
A semi-concrete representation of a solution could be a drawing of three red circles and one blue circle, and the student then counts the four circles. For older learners, a symbolic or abstract representation shows the solved equation 3 + 1 = 4.
Visual strategies can also be used to support solving more complex problems, as shown in the next several examples. As you read each one, take notice of the images that come to mind.
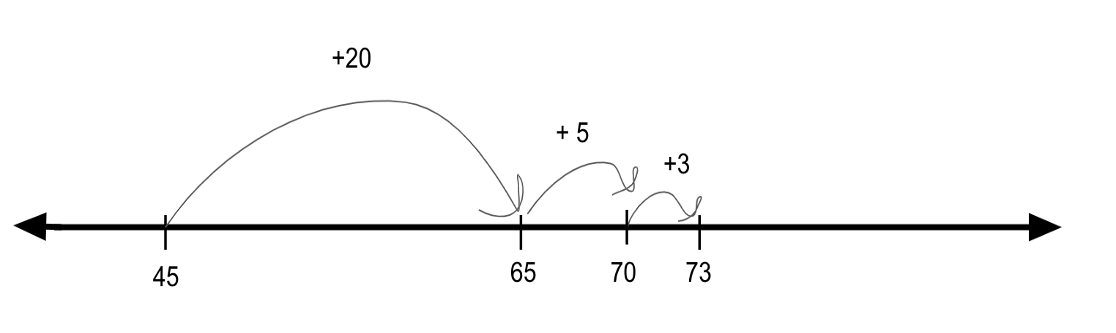
Example 2: An Elementary Grade Expression
Solve 45 + 28
One way to visualize this problem is to think about jumps on an open number line where a learner employs the critical understanding of decomposing numbers. Starting at 45, the larger number, and moving to the right, one could add 28 by jumping 2 tens (or 20) to land on 65. Next, one could jump 5 and land on the friendly number 70. Finally, one could jump 3 to land on 73. Landing on 73 means the sum of 45 and 28 is 73. In describing their work, a student could say, “I started with the higher number 45, jumped 20, then jumped 5, and then jumped 3, to get to 73. So 45 + 28 is equal to 73.”
Example 3: A Middle School Exploration
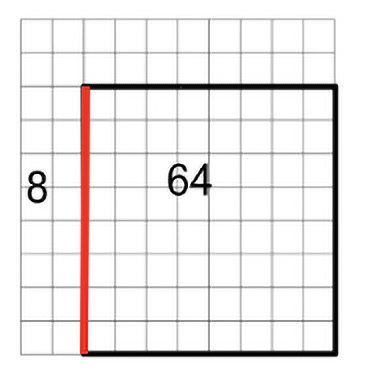
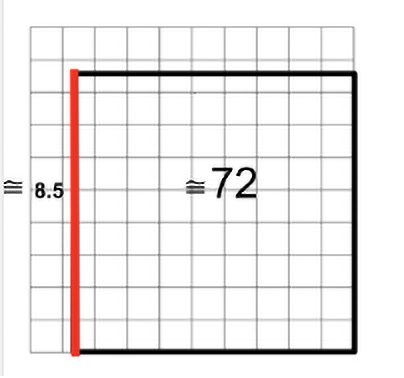
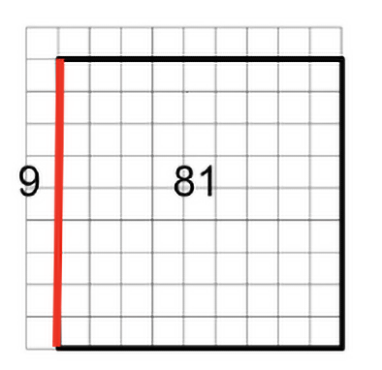
What is the approximate square root of 72?
Starting with the understanding that the square root of a number is the side length of its square, a learner can visualize the approximate square that is created with a non-perfect square number such as 72. Since arranging 72 tiles into a square is impossible, one could think about making one square with a number that is less than 72 and one that is greater than 72, such as 64 and 81. The square root of 64 is 8, and the square root of 81 is 9. Since 72 is about halfway between 64 and 81, one can approximate the side length or the square root of 72 to be about 8.5. A student could describe their work by saying, “I can use the two square numbers that 72 is in between to estimate the square root of 72.”
Example 4: An 8th Grade or High School Exploration
What is the hypotenuse of a right triangle that has leg lengths of 3 units and 4 units?
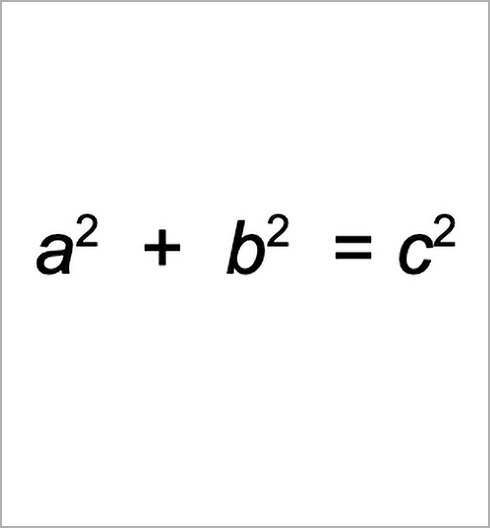
For this question, we explore and apply the Pythagorean theorem, which states that the sum of the squares of the legs of a right triangle is equal to the square of the hypotenuse. By building a model of a triangle, either with tiles or by sketching one on graph paper, the student can visualize the right triangle and the squares that can be created by each side length. The leg with a length of 3 units would create a square with an area of 9 square tiles, and the leg with a length of 4 units would create an area of 16 square tiles. The sum of the two squares is 25 square tiles, which would have a side length (or square root) of 5 units. Therefore, a right triangle with leg lengths of 3 units and 4 units would have a hypotenuse of 5 units.
The Pythagorean theorem can be (1) demonstrated concretely using square tiles, (2) shown in a semi-concrete way by sketching and labeling shapes on graph paper, or (3) represented abstractly by the theorem, which can be used to solve for either the missing value of a leg or the hypotenuse of a right triangle.
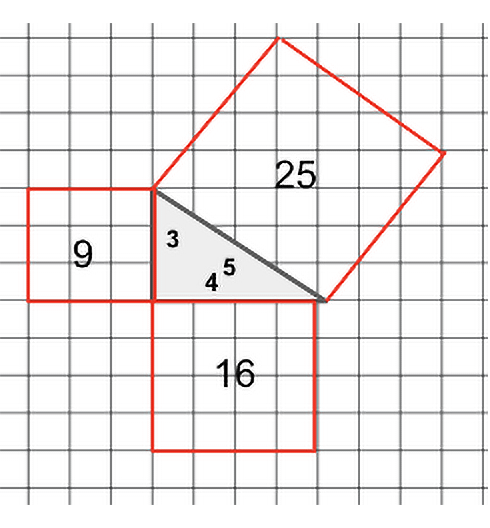
Connecting both the concrete and semi-concrete models to the Pythagorean theorem deepens students’ understanding of the theorem and its relationship to the physical world. A student making the connection between the concrete and abstract could say, “I built a square for each side of the triangle and determined that the sum of the squares of the legs of the triangle was equal to the square of the hypotenuse.”
There are multiple ways of visualizing mathematics to solve the above questions. Did you use the same visual representations illustrated here, or did you have a different way of visualizing? Were you able to make sense of the visual representations shown here? How do these representations enhance the understanding of the mathematical concept?
The examples illustrate that visualizing mathematics is both a support for students who struggle with a range of math concepts and a critical component of learning mathematics. From young children using concrete objects, like their fingers, to understand counting to college students using representational graphs to grasp calculus, visualization provides an avenue to understand mathematics for all students.
Developing Visualization Skills
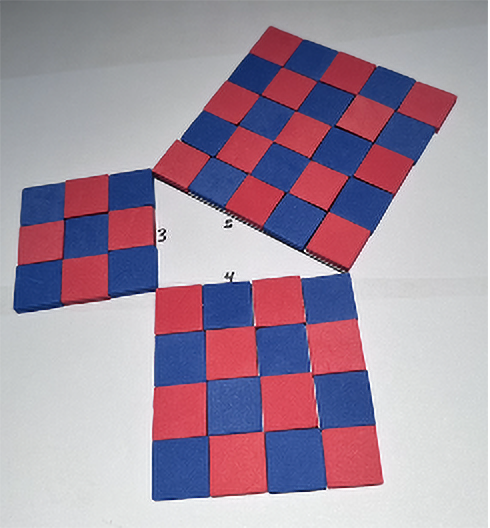
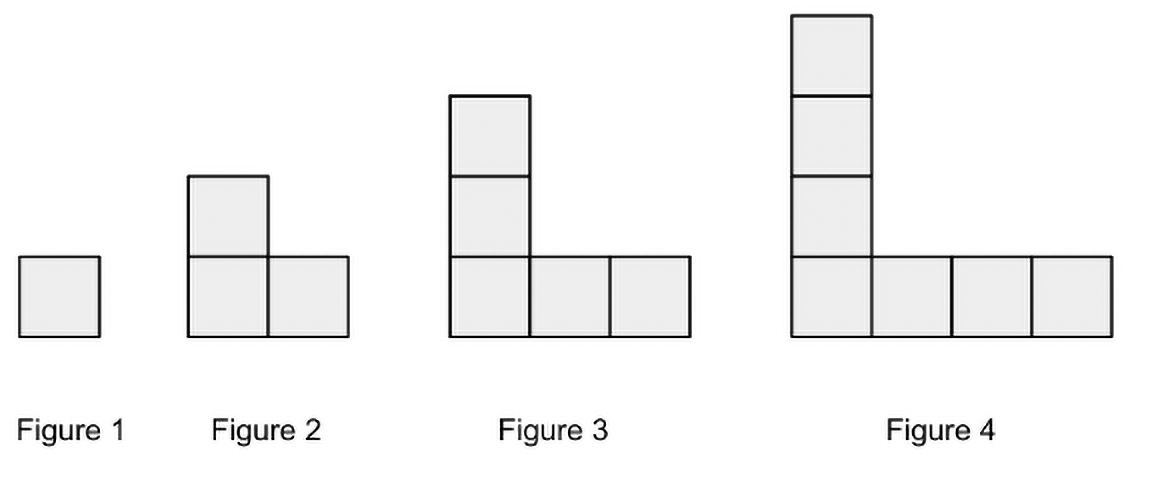
How do we help students develop visualization skills, especially with those whose prior math classroom experience may not have included visualizing? In the book Routines for Reasoning (Kelemanik et al., 2016) the authors explore a Recognizing Repetition routine designed to develop this very skill. Students are asked to build or draw a sequence of figures and then to analyze how the figures are growing by focusing on the repetition, looking specifically at what changes and what stays the same. Students use their analysis to determine the number of tiles needed to build the 10th figure and then determine a mathematical rule that can be applied to determine the number of tiles for any figure number.
Here is an example of a growing pattern that students can explore.
How are the figures growing?
There are multiple ways of visualizing mathematics to solve the above questions. Are you able to make sense of the visual representations shown? Do you use the same ones illustrated here, or do you have a different way of visualizing? How do these representations enhance one’s understanding of the mathematical concept?
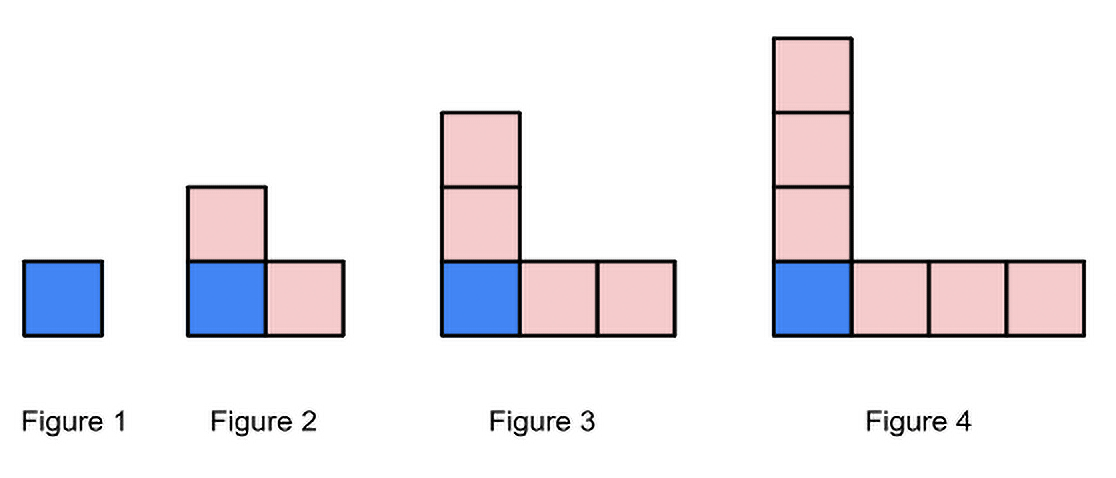
Based on this visualization of the growing pattern, students could determine a relationship between each part of the shape and its figure number. For example, each section of pink tiles is one number less than the figure number. To determine how many tiles would be in the 10th figure, students would know that each section of pink tiles would have 9 tiles (one less than the Figure 10). With 2 sets of pink tiles (9 + 9), plus the blue tile that is constant in each figure (1), students could add 9 + 9 + 1 = 19. Making a generalized rule from this line of thinking, a student might say in words, “Take one away from the figure number, double it and add one,” and then connect their words to the rule written symbolically 2(x – 1) + 1, with x representing the figure number.
Another student might have said, “Double the figure number and subtract 1,” or write it symbolically as “2x –1.” Can you visualize how they determined this rule from the model? Can you determine a general rule by visualizing the growing figures in a different way?
What about the students who initially cannot visualize how to determine the 10th figure? How can teachers support students who may not be able to initially see how the figure grows and/or how to state a generalization? To support this learner, it is necessary for the teacher to listen to students’ responses and be ready to ask questions based on responses. Questions like the ones below may be helpful to ask:
- Can you tell me how you built the first 4 figures that are displayed? Did you notice anything changing? Was there anything that stayed the same?
- Can you build what you think Figure 5 would look like and explain your thoughts?
- If we skip a few figures, can you use what you noticed about how the figures are growing to build Figure 10?
- Is there a way we can use the figure number to determine how many tiles it took to build Figure 3 and then 4? Could these ideas be used to determine how many tiles are in Figure 10 or Figure 100? Could it be sketched out?
- Could we describe the process to find the number of tiles in any figure?
Notice how the questions refer back to the concrete figures. That is, there is a relationship between the visuals made with materials and the language used. Teacher questioning can also enhance the mathematical practice of “Construct viable arguments and critique the reasoning of others” (Common Core State Standards Initiative, n.d.) and provide a vehicle for student-to-student engagement in mathematical discourse. A teacher could consider asking this series of questions: “Another group came up with the idea that if they doubled the figure number and subtracted 1, they would always get the number of tiles for that figure. Does that work? Will it always work? How do you think they determined this?”
The instructional goal of this routine is focused on students’ process of visualizing how the figures are growing, with an emphasis on what changes and what stays the same. Young children can begin to develop this ability by building and discussing age-appropriate pattern sequences with increasing complexity as they move through the grades. As students move into the upper elementary, middle, and high schools, they build on their ability to identify patterns and to generalize these patterns, which can be expressed in words and then with symbols. Explicitly making the connections between the physical pattern, the visualization of the changes in the pattern, and the symbolic representation of the pattern is a cycle that builds mathematical knowledge with understanding.
Connecting the Concrete, Semi-Concrete, and Abstract
From teacher education courses in college to professional development sessions in the field, the message is that students learn mathematics by starting with the concrete and then moving to the abstract. While this is a powerful message, it is important to take a closer look at the learning process.
There is an important step of semi-concrete or visual representation between the concrete and the abstract. It could be argued that this is the step we are asking students to describe when we ask them to show their work with words, pictures, and diagrams. These three steps—concrete, semi-concrete (visual representations), and abstract or symbolic—are not linear. Rather they repeatedly interact. Throughout a unit of study, students’ experience should be one where they go back and forth among these phases of representation with a focus on making the connection between them. It is the students’ understanding of the connection between the concrete, semi-concrete, and abstract that allows for deep knowledge of the content. We each encounter a whole class of students with different learning styles and ways of thinking. Therefore, all three of these methods always need to be available to all students with a continued focus on their interconnectedness.
A plea to all teachers reading this: With the pressures of test scores, pacing charts, and unfinished learning from the pandemic, many times we feel pulled to emphasize the abstract and only use concrete representations for students who have perceived challenges in learning mathematics. This blog post is making the case to reimagine the idea of moving from the concrete to the abstract to not only include the semi-concrete visual representation but to reconceptualize mathematics instruction as a continual interplay of the concrete, semi-concrete, and abstract representations of mathematical ideas for all students.
Here are a few suggestions:
- Be sure that concrete materials are always present and available for student use.
- Refer to concrete materials and connect them to the visual representations and abstract thinking of all students throughout the unit of study.
- Have an expectation that “show your work” goes beyond the symbolic representation to include pictures, a model, and/or words to explain solutions.
- As teachers, complete the mathematical tasks yourselves, a key component of Math for All, to explore and understand the various physical models, visual representations, and symbolic processes that can be developed in support of the mathematical content.
- Value the concrete models and pictures of the mathematical content in a similar way to how science classes value the physical materials and pictures of the science content.
- Provide opportunities for students to explore mathematics visually.
References
COMMON CORE STATE STANDARDS FOR MATHEMATICS. (n.d.).
Kelemanik, G., Lucenta, A., Janssen Creighton, S., & Lampert, M. (2016). Routines for reasoning: fostering the mathematical practices in all students. Heinemann.
The contents of this blog post were developed under a grant from the Department of Education. However, those contents do not necessarily represent the policy of the Department of Education, and you should not assume endorsement by the Federal Government.
This work is licensed under CC BY-NC-SA 4.0 ![]()
![]()
![]()
![]()
Math for All is a professional development program that brings general and special education teachers together to enhance their skills in
planning and adapting mathematics lessons to ensure that all students achieve high-quality learning outcomes in mathematics.